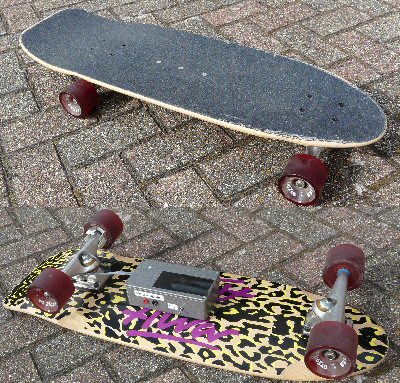
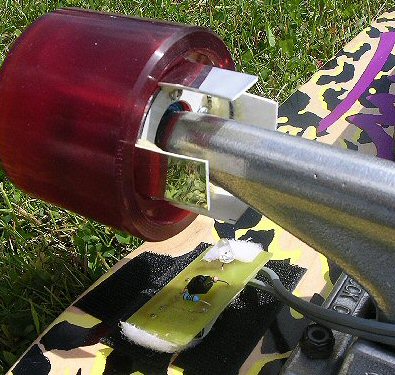
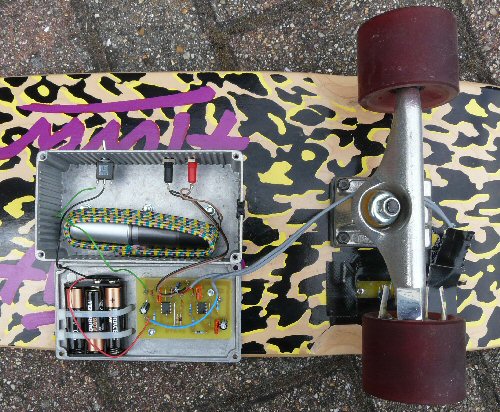
Skateboard speedometer MKI
Jonathan Hare, The Creative Science Centre, Sussex University

Please also see the main article for more details Longboard Speedo

worthing pier sea side jj on board skate stopper start of path


MK3


skate board


Please also see the MK2 and MK3 versions

Skateboard speedometer
This is a device that fits under the skateboard deck and measures the rate at which the wheels are turning. This rate is proportional to the speed of the skateboard, so the device can measure the speed.

How it works
The device works by monitoring the rotation of one of the wheels. One wheel has four plastic mirrors fitted to it that rotate as the wheel goes around. I have tried various configurations and found that fixing it to the back of the wheel (towards the centre truck) is reliable and seems to survive use ok.

skate board detector diagram


The circuit detects movement of the wheels by the reflection of an IR beam as the mirrors rotate. The invisible IR beam is produced by an IR LED and is pulsed (modulated) at about 38 kHz. A standard remote control receiver circuit IC is used to pick up this 38 kHz modulated signal. This is a tuned device specifically designed for these frequencies (used to detect the signal from a TV remote control etc.) and so makes detection easier and more robust. Every time a mirror reflects the IR beam into the IR detector IC it creates a pulse. This pulse triggers a timer than converts the variable length pulse from the IR IC (which depends on the speed of wheel rotation etc.) into a standard pulse length (3 ms ON duration). This (monstable) timer also prevents the o/p going full ON (and suggesting a very fast speed) if the skateboard rests in a position where the IR continually triggers the detector.

skate board skate board
Left: you can see the mirors attached to the back of the wheel. The IR dectector (small black device) and transmitter (white LED) can be seen attached to the skateboard. Right: close up of the mirror holder made of tin which is cut and four tabs are bent upward to which the four plastic mirrors are glued to.


Maximum possible speed detected
As there are 4 mirrors on the wheel each full rotation will create 4 pulses. The maximum speed recordable will be when there are so many 3ms pulses per second (1000ms) that there is never any OFF time between them. This will occur when there are:

1000 / 3 = 330 pulses / second
which is 330 / 4 = 85 rotations / second

Now my skateboard wheels have a diameter of 62 mm which gives a circumference of about 20 cm
which will cover 85 x 20 = 1700 cm = 17m / sec at top rate
which is 17 x 60 x 60 / 1000 = 61 km per hour, or about 35 mph

Logging the speed
The pulses produced by the timer are then fed into a simple integrating circuit that averages the pulses. This produces a voltage proportional to the number of pulses per second in other words a voltage proportional to speed. I used a small stand-alone usb data logger that can be set-up to take regular measurements between 0 - 30V. For the skateboard speedo I set it up to take 1 measurement a second. In this set-up it will log continuously for about 9 hours.

close up of elecronics
The metal box houses the electronics and data logger. Here the top has been unscrewed and you can see the electronics pcb and batteries fitted to the lid while the data logger (with large band around it to keep the plug-socket tightly connected) is in the main section of the box. You can also see the ON/OFF switch on side of the box (top) and also two sockets where a volt meter can be fitted to test the o/p once everything is assembled and ready to go. If a meter is plugged into these sockets you can easily tests everything is working ok by turning ON and spinning the miror wheel which should show a signal of a few volts on the meter.


I put a large elastic band around the logger so that the connection will remain good despite the vibrations it will undergo as we travel around. The logger was also wrapped in bubble wrap and then squezzed into the case before screwing on the lid. After using the skateboard I remove the logger, fit it into a usb socket on my PC or laptop and download the data. This data can be loaded into a spread sheet, manipulated in any way you want and then graphed.

Calibration
Measure the time (t) it takes to go along a known length (L). This will give you an average speed v = L / t. Try to go at as constant a speed as possible. If you stay still for 10 seconds, or so, at the start (beginning) and stop (end) you will clearly see the route data on the logged information. The logger takes readings at regular and precise intervials so if you know when you start and stop you can use the number of logs to determine the time it took to run this distance. You can then look-up the distance L on a map (or Google Earth). The average speed can be determined by dividing the distance (miles) by the time (hours) to get mph for example. By comparing the voltage logged with the estimate of the average speed you can work out the scaling factor K that you need to apply to the logged voltage to convert it for example to mph

For my set up a speed of 10 mph gave a voltage of about 1.8 V making K = 10 / 1.8 = 5.56. When this is applied to the logged data on a spreadsheet and then plotted out the verical axis gives the speed in mph and the horizontal axis gives the time (seconds from the start).

Results
As a first easy test I tried out the speedo on the seafront promenade between the outskirts of Lancing (Brooklands) and Worthing pier a distance of just under 2 miles. It's an easy, not too busy, straight and flat route.

The speed plot shows up a number of things and I have reproduced these in more detail below. These are marked with numbers on the top picture / data and are shown below in more detail (Note: in the close-ups I have reversed the time axis back to the usual direction) as follows:

[1] The route took me about 15 minutes (actually about 1100 seconds, see graph scale) which averages out at about 8-9 mph (K = 5.56) and this agrees with the average we see on the graph calibrated from the car speedo.

[2] At various places along the route there are crossings with corrugated paving slabs designed to remind people of the crossing - not great for skating on. I tended to stop, get off and restart skating at these points. You can clearly see these stop-points on the graph.

[3] As its a relatively flat surface one only has to skate / push every 5 to 10 seconds and this too is very clearly shown in the plots of the speed. You can see the rapid acceleration every time the foot pushes the board forward and then the slowing down till the next 'kick' / push occures. At times here I have been able to keep up a decent average speed quite easily.

pushing

Each spike on the graph is a push of the foot required to keep up the speed while skating. It's easy on this simple route to keep up a speed of ca. 8 - 10 mph.


[4] When the path becomes very smooth its nice to stop pushing and just enjoy 'surfing' along.

freewheeling
This plot shows the skateboard freewheeling after a few good pushes / skates. Its not completely smooth because the data logger only takes 1 measurement per second. The graph shape has steps on it because the board has slowed a bit each time a measurement is made. You can see that there is a sharp increase in speed (at about 360 seconds) when I finally give another push


[5] Coming into town the sea side path joins with the town prominade and there is more people about. I have to look around me a bit more to make sure I am not in the way of other traffic behind me and also concentrate on the on-coming traffic. You can see that I actually stopped for some time to work out the best route before making my way on to the pier, my destination.


Further investigations
The logged data give use the speed of the scateboard. Using calculus we can derived more informaton from this data. Firstly if we integrate the data up to a certain time we will get the total distance skated at any time. This requires an accurate calibration but in principle we can use this as a mile-ometer. If we diffirentiate the data with respect to time we will get the moment to moment magnetude of accelerations. If we know the mass of the skate board and skater we can use this to estimate forces. This may be of use in determining why some tricks are so hard and also perhaps help train to do other tricks. For example noting the parts of the trick that might have maximum in speed and acceleration. The speedo does not measure the direction of the velocity just the magnetude.

THE CREATIVE SCIENCE CENTRE


Dr Jonathan Hare University of Sussex, Brighton.
e-mail: j.p.hare@sussex.ac.uk

home | diary | whats on | CSC summary | latest news