March 20th 2015 ECLIPSE PAGE
Location: Brighton, UK. Eclipse type: partial (85%), start: 8:24, maximum at 9:30, end: 10:40 UTC
I was away during the 20th March 2015 eclipse so I set up a very simple experiment to record the event without me. I connected a solar cell to a data logger and recorded the voltage with it pointing south. The solar cell was a standard (ca. 4cm x 7cm) type that has a covering of small plastic lenses designed to make it less sensitive to changes in the position of the Sun. It is the sort of device that Maplin Electronics stock for home experiments and produces about half a volt in sunshine. It is part of a unit I made up to demonstrate solar cells and solar power (see this link). (Note: In these experiments I added a R=68 ohm load resistor across the cell so that the power could easily be calculated by P = V2 / R and I kept this in place for these measurements). The data logger was a Testo 175-S2 which was set for 1 log every 20 seconds (I used the 0-1 volt input).
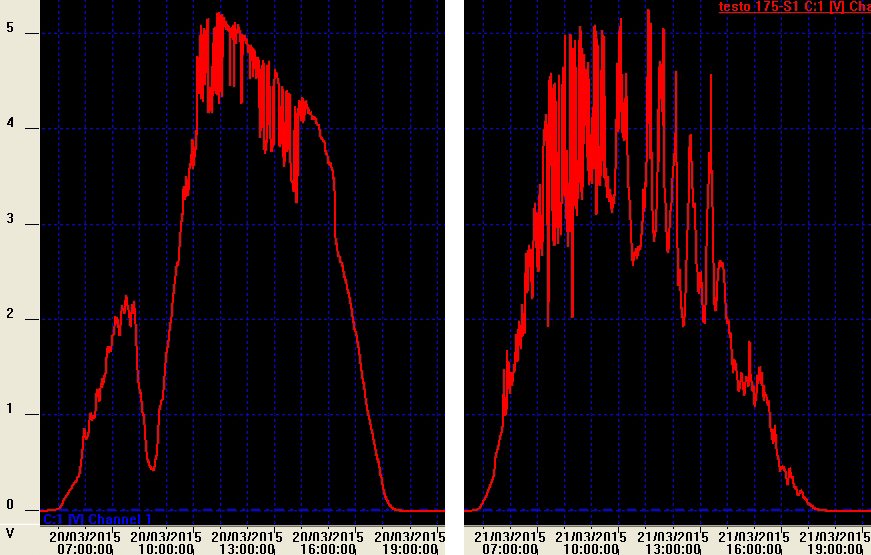
The data is plotted out above. The vertical scale of 0 to 5 represents 0 to 0.5 volt from the solar cell while the horizontal scale is time (two days are shown: 20th and 21st March 2015). On the 21st March you can see a whole 'day' of voltage logged while the sun was out (sun up about 6am, sun down about 6pm) although the voltage varies quite a lot due to the cloud cover changing throughout the day.
My neighbours commented that the sky only really went a little darker for the few minutes of the eclipse maximum. So I was expecting the data logger to record something but perhaps something a bit like the sharp 5 to 10 min changes created when the cloud cover varies (e.g. the noisy lines you see so clearly all day on the 21st March). But actually what I recorded was something more interesting: a much longer, deeper dip for about 1 1/2 hours - from when the Moon started to cover up the Sun at 8:30 until it left the Sun about 10:40. I was quite surprised.
Looking at the recorded data we can see that on the eclipse day - the 20th March - you can see a similar plot to the 21st but now there is also a prominant dip, or drop in voltage around 9:30 am at the time of the eclipse maximum. The eclipse was only partial (85%) for my location: the Moon started to cover the Sun around 8:24 am reached its maximum coverage around 9:30 and passed away from the Sun by 10:40. The solar cell plots show an increase, as the sun rises from about 6 am till about 8:30. After 8:30 the voltage drops away and shows a minimum at about 9:30 am at the time of the eclipse maximum. Note: the total eclipse voltage did not go down to zero (i.e. the night time value) because it was a partial eclipse. The voltage then rises slowly to join what it would have been without the eclipse at about 10:30.
As it was only a partial eclipse the overall change in light level would be less than one would get in a full eclipse. However even with a partial eclipse the fading light will cause the pupils in our eyes to slowly open-up allowing more light in. As this is quite a slow effect at the start and end of the eclipse an observer might not think the light dropped much because of the way the eye adjusts to the slowly changing light. It makes sense that an observer will only perceive a dramatic change in light for the few minuets of the maximum of the eclipse and not notice the light slowly falling and rising the rest of the time. A solar cell of course does not have a pupil adjusting the light falling onto it and so will faithfully record the exact way the light is changing.
Our partial eclipse was 85% - which means that about 15% of the solar disc remained at the eclipsed maximum. So we would not expect the solar cell voltage to drop to zero at the eclipse maximum because there was still quite a lot of light - which is what we see in the data. The minimum solar cell reading (at the maximum of the eclipse) should therefore be about 15% (x 0.15) of the voltage that we would have expected without the eclipse. Looking at the shape of the curve it looks it would have been about 2.5 at 9:30 am if the eclipse had not taken place (which is 0.25 Volt as the vertical scale of 0 to 5 represents 0 to 0.5 volt ). Using this estimate we would get an eclipse maximum solar cell value of 2.5 x 0.15 = 0.38 (which is 0.04 Volt). From the data we see that the minimum recorded value was about 0.4 which now makes sense.
The way the intensity of the light changes over time as the eclipse takes place is quite complex. If for the sake or argument the Sun and Moon were square and the Moon moved over the Sun blocking out the light you might expect the intensity to drop evenly (linearly) and then return over the course of the eclipse. But of course the Sun and Moon appear as discs and so the light varies in a more complex way. You can explore the maths here (and links from it) Lune - Wolfram page. This complex varation in brightness over the eclipse will create the particular shape and width in the voltage profile created by the solar cell.
Solar cells respond to a wide range of electromagnetic radiation: from the far Infrared (IR) through to the visible and then the ultra-violet (UV). Solar cells tend to be most sensitive at the UV end of the visible light spectrum (but the plastic lens coating on my cheap solar cell will absorb much of the invisible UV). The solar cell will therefore detect more light (IR, visible, UV) than the eye (visible) will see. The eclipse will of course also affect the IR and UV levels. The drop in UV at the eclipse is interesting. Radio Amateurs in the UK were making some measurements around the eclipse expecting the changes in UV to effect the ionisation in the atmosphere modifying the way radio waves are attenuated and refracted back to Earth. You can read about the radio experiments here: RSGB eclipse experiments and here Early results from eclipse experiments.
Another interesting aspect to consider is that the light arriving from the Sun is scattered considerably by the molecules and small particles of our atmosphere. This 'Rayleigh scattering' depends on the wavelength (λ), actually 1 / λ4 so the shorter (blue) waves are scattered more than the longer (red) waves. This makes the whole sky bright and is why the sky is blue. An observer on the Moon (no atmosphere) looking up would see black space not blue sky. A solar cell on Earth will therefore create a voltage from the bright sky even without direct sunlight (although the power generated is less than with direct sunshine). A cloud, or perhaps a plane, passing over might block out the direct Sun light to where you are but it will not effect the colour or brightness of the blue sky because this is created by the scattering of the light coming in from space (which the plane / cloud can't of course block). During an eclipse however the Moon blocks the sun light way out in space, and so the scattering will also be reduced producing all sorts of unusual colours of the ground light and sky. The reduction in the direct and scattered light during the eclipse also helps to explain why my solar cell recorded a prolonged dip over almost the whole of the astronomical event.
Overall then people watching the partial eclipse only really noticed a change in the brightness of the light during the few minutes at the eclipse maximum. The simple solar cell measurements however recorded more than our brains and eyes could perceive.
Extra Information
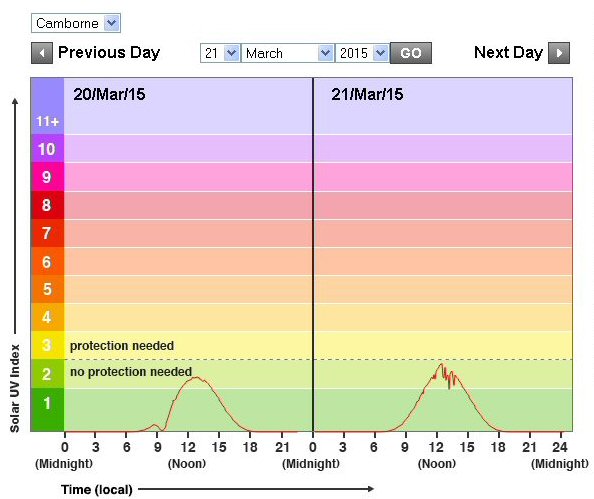
Defra funds spectral UV monitoring at Reading and Public Health England (PHE) operates a network of nine broadband UV monitoring stations. Below is a screen grab from the UV station at Camborne for the period 20 and 21st March 2015. You can clearly see the UV dip produced by the eclipse with a similar profile to my visible measurement. This data can be found at http://uk-air.defra.gov.uk/data/uv-index-graphs.
Dr Jonathan Hare, E-mail: jphcreativescience@gmail.com
NOTE: Although none of the experiments shown in this site represent a great hazard, neither the Creative Science Centre,
Jonathan Hare nor The University of Sussex can take responsiblity for your own experiments based on these web pages.
THE CREATIVE SCIENCE CENTRE
home | diary | whats on | CSC summary | latest news