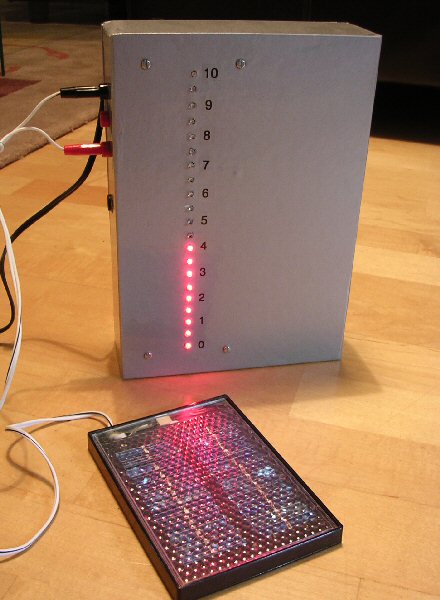
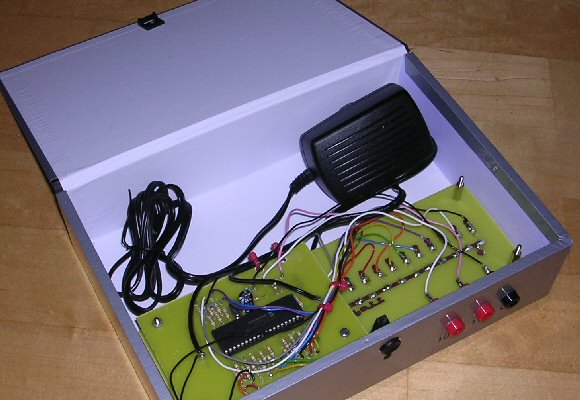
Multimeters are very useful for displaying voltages and currents in a circuit, or experiment, to a small audience but in a school class or lecture environment they are a little too small. To overcome this I have used a video camera to feed a video signal to a data projector to show the meter on the large screen but this is fiddly (re. focus and lighting) and requires switching from presentation to the camera and back again etc. I built this 21 LED bar-graph meter as a simple-to-use device to overcome this. It shows a linear growing bar-graph of lights as the voltage increases. 0 - 10V and 0 - 1V inputs are available. So that the device could accept 1V as well as a 10V on the same input pin (with dropping resistors) I set the software so that a 1V input gave a full scale 'deflection' (FSD) of all 21 LEDs glowing rather than a 5V FSD. I build the device in a A5 box file and when not in use the 5V power supply and the input cables can be stored inside the case. In the photo you can see the LED bar graph meter showing the voltage developed by a solar cell with a lamp light falling on it.