Long term geiger counter measurements
I used a 16F877 PIC and programmed in PICBASIC (a basic compiler from Crownhill Inc.). I initially used the BASIC 'pulse in' function but I had problems when also using the TMR0 timer register to give a time interupt (it presumably uses the same function!).
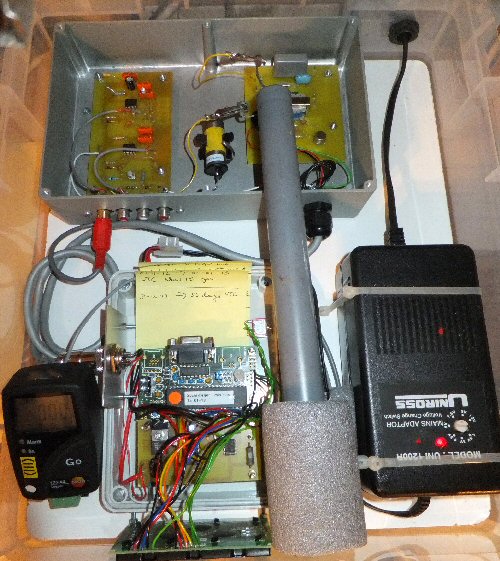
The logic pulse o/p in Fig. 2 of the geiger counter circuit (click here for geiger circuit ) goes to the PIC. I made up my own test loop to check for pulses coming in from the geiger circuit. I used bit 4 (the 5th pin, remember the first is '0') on Port C (PORTC.4) and tested for a high to low transistion. Each time this happens a counter (C) is incremented. If the counter goes beyond 255 it is set at 255 (so that the DAC does not run over). TMR0 is used as a time interupt and the programme allows C to increment with gieger pulses for 10 mins. After 10 mins the value of C goes to the DAC. PORTC.5 is used to enable the DAC (clocks data onto DAC on a low transistion). The LCD screen shows the current running counts and the last three 10 min totals (i.e. 10 mins, 20 mins and 30 mins ago).
I tested the device for a full year in 2012 on a 2.5cm tube and at the start of 2013 I swapped over to a 25cm long gieger tube (giving ca. 100 and 1000 counts / 10 min respectively). The geiger tubes produce pulses that the PIC counts and converts the counts into an 8 bit number. So for example if 100 counts are collected over 10 mins the PIC circuit will create '100' out of a total of '255' on the 8-bit range. I used a DAC to convert this to a 0 - 2.5V voltage (0 = 0, 255 = 2.5V) which goes to a analogue voltage data logger set-up to record for about 2 months (one log every 10 mins) before removing and downloading to a PC. I already had these professional data loggers so I used them in this experiment but I hope to extend the PIC part of the device to log the data directly onto a CF card (with time-stamp etc.).
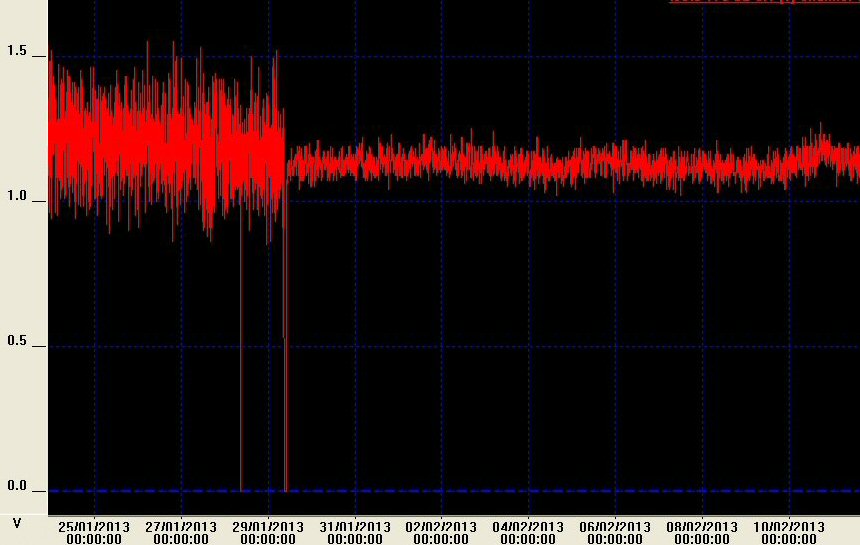
Below is the data for the 25cm geiger tube. The (more noisy) left hand side data is recording made using 1 min bins while the right hand side is for 10 mins bins (but the 10 min total devided by 10 to get the same counts / min). The data logger actually measured once every 5 min so much of the 1 min bin data is lost, while the 10 min bins is effectively doubly recorded by the data logger. There is a small but intriguing rise in the geiger counter counts around the 11th Jan 2013. We see the counts rise ca. 10%, from a typical background of 110 counts / min to 120 counts / min. There was a solar storm around the 9th Jan 2013 and so it would be interesting to see if the increase in background counts was due solar ejected material arriving at the Earth (i.e. it may be that this set-up is recording secondary radiation produced by the solar material interacting with the earths atmosphere / magnetosphere) ... I need to check that other factors were not contributing.
| Geiger counter |
NASA data solar storm 09_02_13 |
Solar storm 09_02_13 |
PIC page |
THE CREATIVE SCIENCE CENTRE
home | diary | whats on | CSC summary | latest news